Blog 
Click here to go back
State SNF Occupancy Percentage Maps
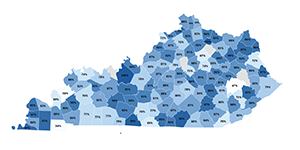
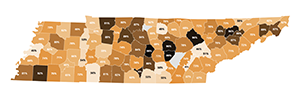
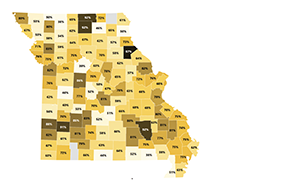
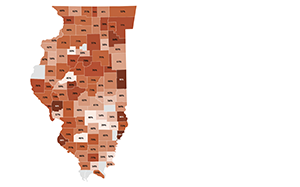
How does your facility compare to the average occupancy in your county?
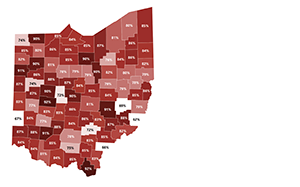
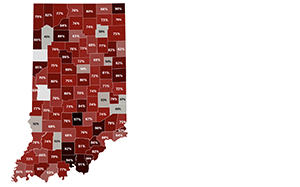
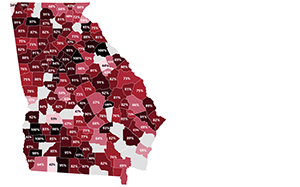
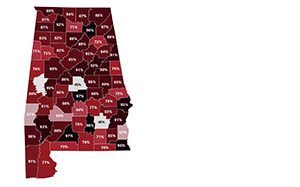
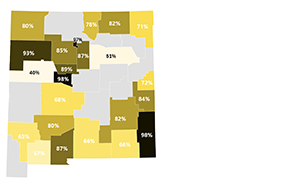
Take a look at your state map below for the SNF Occupancy % By County as of September 30, 2024.
As of September 2024
Kentucky
Click here to view a high quality PDF of the Kentucky map.
Tennessee
Click here to view a high quality PDF of the Tennessee map.
Missouri
Click here to view a high quality PDF of the Missouri map.
Illinois
Click here to view a high quality PDF of the Illinois map.
Ohio
Click here to view a high quality PDF of the Ohio map.
Indiana
Click here to view a high quality PDF of the Indiana map.
Georgia
Click here to view a high quality PDF of the Georgia map.
Virginia
Click here to view a high quality PDF of the Virginia map.
Alabama
Click here to view a high quality PDF of the Alabama map.
New Mexico
Click here to view a high quality PDF of the New Mexico map.
If you need assistance, please contact our office. Call us at (270) 726-4033.
Shawn Steele, Accountant


